How Much Should You Have Saved for Retirement by 30, 40, 50?
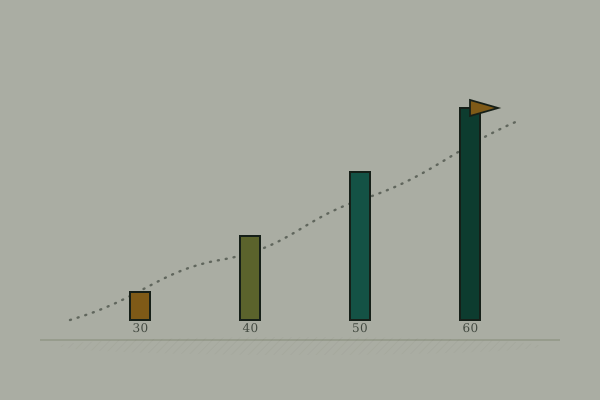
“Have 1x your salary saved by 30, 3x by 40” gets repeated across personal finance content constantly, usually with no explanation of where the numbers come from or whether they’re actually realistic. I built a simple, transparent model from scratch to see what it would take — and the honest answer about being “behind” might surprise you.
The one-sentence version
A common salary-multiple benchmark says to have roughly 1x your salary saved by 30, 3x by 40, 6x by 50, and 10-14x by retirement — and a simple model (consistent saving rate, realistic market return) reproduces numbers in that same range, which is reassuring, but the actual takeaway is about direction and consistency, not hitting an exact number on an exact birthday.
The model, shown transparently
Here’s what I actually computed, with every assumption stated plainly: starting salary of $50,000 at age 25, saving 15% of salary every year (a reasonable combined target between personal contributions and any 401(k) match), salary growing 3%/year, and a 7% average annual investment return — the same long-run benchmark used in earlier posts on this blog.
| Age | Account balance | Salary at that age | Multiple of salary |
|---|---|---|---|
| 30 | $57,502 | $59,703 | 1.0x |
| 40 | $252,648 | $80,235 | 3.1x |
| 50 | $684,518 | $107,830 | 6.3x |
| 60 | $1,598,562 | $144,914 | 11.0x |
| 65 | $2,374,270 | $167,995 | 14.1x |
This lines up closely with the “1x by 30, 3x by 40, 6x by 50” benchmarks that circulate widely — not because I built the model to match them, but because a realistic 15% savings rate at a realistic return genuinely produces numbers in that range. That’s worth knowing: these benchmarks aren’t an arbitrary external standard, they fall naturally out of consistent saving over time.
Why the multiple accelerates so much after 40
Notice the balance doesn’t grow in a straight line relative to salary — it goes from 1x to 3x (a 3x jump) in the 30s, then 3x to 6x in the 40s, then 6x to 11x in the 50s. This is compounding doing exactly what it does: the early contributions have decades to grow, and by your 40s and 50s, a meaningful share of the balance is investment growth on top of growth, not new money going in. The slow-looking early years aren’t wasted — they’re the years buying the most total compounding time.
Why “I’m behind” isn’t the useful question
These are a reasonable illustrative benchmark, not a verdict. Real circumstances vary enormously — student loan debt delaying contributions, a lower starting salary, a career change, kids, a region with a higher cost of living. Comparing your specific number to a generic multiple and feeling behind is close to meaningless without knowing whether the multiple’s underlying assumptions (15% saved since 25, 7% returns, steady salary growth) match your actual life, which they usually don’t exactly.
The useful question isn’t “am I at the benchmark” — it’s “is my net worth trending upward, and am I saving a consistent percentage I can actually sustain.” Someone starting seriously at 32 instead of 25 isn’t doomed relative to this model — they’re running the same math with a later start, which the model handles by simply needing a higher savings rate or more time, not by being locked out of a reasonable retirement.
What actually moves you toward or away from these numbers
- Starting earlier matters more than almost anything else here, for the same reason compounding always rewards time more than amount.
- The savings rate is the lever you control most directly — 15% was the number in this model, but 10% or 20% changes every figure in that table meaningfully.
- Fees matter more than they look like they should — a high-expense-ratio fund can quietly erode years of this growth.
- Market returns are the one variable nobody controls — 7% is a reasonable long-run planning assumption, not a promise, and any specific decade can run well above or below it.
The takeaway
The “1x by 30, 3x by 40” benchmarks aren’t an arbitrary external bar — they fall out of a transparent model built on a realistic, sustained savings rate and a realistic market return. Useful as a general compass, not as a report card: if your own number is behind the model, the actionable response isn’t anxiety about a specific multiple, it’s checking whether your current savings rate and timeline, run forward, get you somewhere reasonable — the same math, starting from wherever you actually are today.
Discussion